问题引出
- 绘图默认出来的结果字体不满足要求,要求
xlabel , ylabel ,title和legend的字体变大一点. - 字体设置变大之后,导致
xlabel ylable等等显示不完全,设置figsize变大也没有用处,设置 dpi 变大也没有用处,反而显示的线型变粗了,图像更加糟糕.
- 在图像中,有六条线,要根据点划线的点和线的长度进行区分.
解决方案
- 针对第一个问题:使得字体变大,在
ax.set_xlabel,ax.set_xlabel,ax.legend方法中都有一项fontsize参数,可以更改.也可以通过rcparams参数进行更改 . 默认的使用是rcparams参数中的值.例如
    ax.set_xlabel(xlabel='xlabel',fontsize=20) # 设置label的字体大小
    ax.legend(loc='lower right',fontsize=20) # 设置legend的字体为20
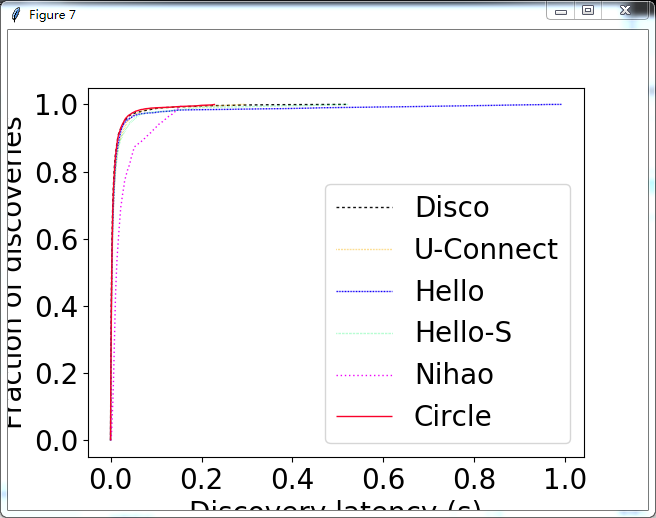
- 字体设置变大之后,图像变为了
, 其实这个原因不是因为图像大小太小了,而是xlabel和ylabel所占的空间变大了, axis 的占用空间比例还是那么大,所以将xlabel和ylabel所在的区域往边界挤出去了一部分.只需要将axis所占的比例变小一点就行,例如如果想让ylabel显示的完全,就需要将axis向右边移动一下,如果向让xlabel和title显示完全,需要将axis稍微压扁一下.这个可以通过Divider,Size,LocatebleAxes共同来实现. 最主要的就是 divider 根据 h,v 的设置,将整个 figure 分割开来,再将中间部分设置为 axis 显示部分.例如:
    h = [Size.Fixed(3.0), Size.Scaled(1.), Size.Fixed(.2)]
    v = [Size.Fixed(3), Size.Scaled(1.), Size.Fixed(.5)]
    divider = Divider(fig, (0.0, 0.0, 1., 1.), h, v, aspect=False)
    ax.set_axes_locator(divider.new_locator(nx=1, ny=1))
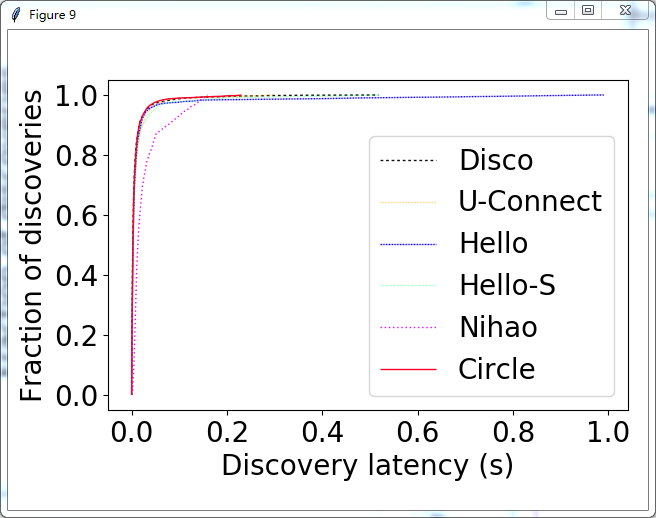
显示结果为1:
其中 figsize 和 dpi 的作用具体参照这个链接,其中 figsize 和 dpi 共同决定了图像的大小, figsize 和 dpi 的乘积代表的是图像像素的长和宽,和实际上的英寸没有关系, dpi 是代表的是没有一个平方英寸所拥有的像素点的多少,而 axis 中的线和绘制和文本的打印都是以PPI 来绘制的,(期间一些关系,我也不是很明白),最后结论是dpi不会影响线型的宽度和字体的显示的大小. figsize 和 dpi 两个参数像是绘图用的纸张的型号,例如A4,A1等等,dpi 像笔的粗细,如果 dpi 变大,笔头变粗,但是 dpi 又是一个控制纸张大小的因素,所以图的像素长宽会变大.
- 对于只用点划线点和线的长度来定义线型,在
ax.plot方法中有linestyle中这个参数可以确定点和线的长度.同样也可以通过``linewidth` 设置线的宽度.示例为:
    ax.plot(ms_2_s(u_connect_cdf_x),u_connect_cdf_y,color='#f9b201',linestyle=(0,(0.3,0.8)),linewidth=1,label='U-Connect')
    ax.plot(ms_2_s(hello_cdf_x),hello_cdf_y,'#1501f9',linestyle = (0,(1,0.4,0.2,0.4)),linewidth=1,label='Hello')
    ax.plot(ms_2_s(hello_s_cdf_x),hello_s_cdf_y,c='#01f964',linestyle=(0,(0.2,0.8)),linewidth=1,label='Hello-S')
    ax.plot(ms_2_s(nihao_cdf_x),nihao_cdf_y,'#f001f9',linestyle = (0,(1,2)),linewidth=1,label='Nihao')
    ax.plot(ms_2_s(circle_cdf_x),circle_cdf_y,'#f9012a',linestyle=(0,()),linewidth=1,label='Circle')
代码
# coding: utf-8
import matplotlib.pyplot as plt
from mpl_toolkits.axes_grid1 import Divider, LocatableAxes, Size

def demo_fixed_size_axes():
    fig1 = plt.figure(1, (6, 6))
    # The first items are for padding and the second items are for the axes.
    # sizes are in inch.
    h = [Size.Fixed(3.0), Size.Fixed(1)]
    v = [Size.Fixed(3), Size.Fixed(5.)]
    divider = Divider(fig1, (0.0, 0.0, 1., 1.), h, v, aspect=False)
    # the width and height of the rectangle is ignored.
    ax = LocatableAxes(fig1, divider.get_position())
    ax.set_axes_locator(divider.new_locator(nx=1, ny=1))
    fig1.add_axes(ax)
    ax.plot([1, 2, 3])

def demo_fixed_pad_axes():
    fig = plt.figure(2, (6, 6))
    # The first & third items are for padding and the second items are for the
    # axes. Sizes are in inches.
    h = [Size.Fixed(3.0), Size.Scaled(1.), Size.Fixed(.2)]
    v = [Size.Fixed(3), Size.Scaled(1.), Size.Fixed(.5)]
    divider = Divider(fig, (0.0, 0.0, 1., 1.), h, v, aspect=False)
    # the width and height of the rectangle is ignored.
    ax = LocatableAxes(fig, divider.get_position())
    ax.set_axes_locator(divider.new_locator(nx=1, ny=1))
    fig.add_axes(ax)
    ax.plot([1, 2, 3])

if __name__ == "__main__":
    # demo_fixed_size_axes()
    demo_fixed_pad_axes()

    plt.show()